Skip to content
Menu
Blog Landing Page
On location
The Farallon Team’s thoughts on GIS and geospatial trends, location technologies and applications.
Farallon Round-up: CalGIS 2025
by
Alex Wuthrich
April 21, 2025
By
Alex Wuthrich
March 19, 2025
Reference Data Manager for Concept Hierarchies: What, Why, and How
By
Alex Wuthrich
March 10, 2025
Turning Data into Recovery: Understanding the Story of LA’s Fire Damage
By
Alex Wuthrich
February 24, 2025
Data Models for YOUR Business
By
Alex Wuthrich
January 22, 2025
Technical Spotlight: Searching by Related Resources in Arches
Stewardship Evolved: Arches and esri for Seamless Data Integration
By
Alex Wuthrich
January 16, 2025
By
Alex Wuthrich
November 26, 2024
The Farallon Round-up: Farallon Geographics Wrapped 2024
By
Alex Wuthrich
November 21, 2024
The Right Tools For The Job
By
Alex Wuthrich
November 13, 2024
When Is a Cultural Heritage Inventory Not a Cultural Heritage Inventory?
by
Alex Wuthrich
November 7, 2024
Why Have a Cultural Heritage Inventory Part 2: Leverage Your Resources to Make Informed Decisions
view more stories
By
Alex Wuthrich
October 14, 2024
Resource Stewardship in a Changing World
By
Alex Wuthrich
October 7, 2024
Historic England Officially Launches Arches for HERs To Enhance Data Management Capabilities
By
Dennis Wuthrich
August 8, 2017
Deploying ArcGIS Portal and Your First Web Applications with the LGIM
By
Dennis Wuthrich
May 24, 2017
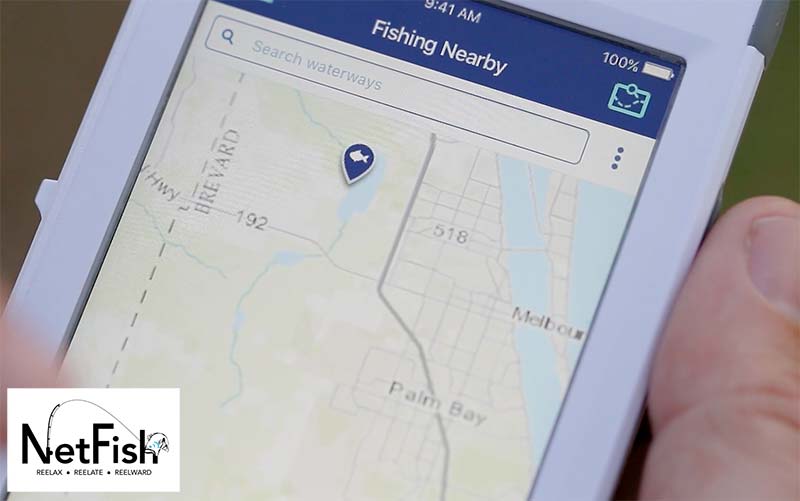
Use your mobile phone to find the best fishing hotspots near you
By
Dennis Wuthrich
April 18, 2017
Port of San Francisco Uses Enterprise GIS to Prepare for Sea Level Rise Caused by Climate Change
By
Dennis Wuthrich
January 3, 2017
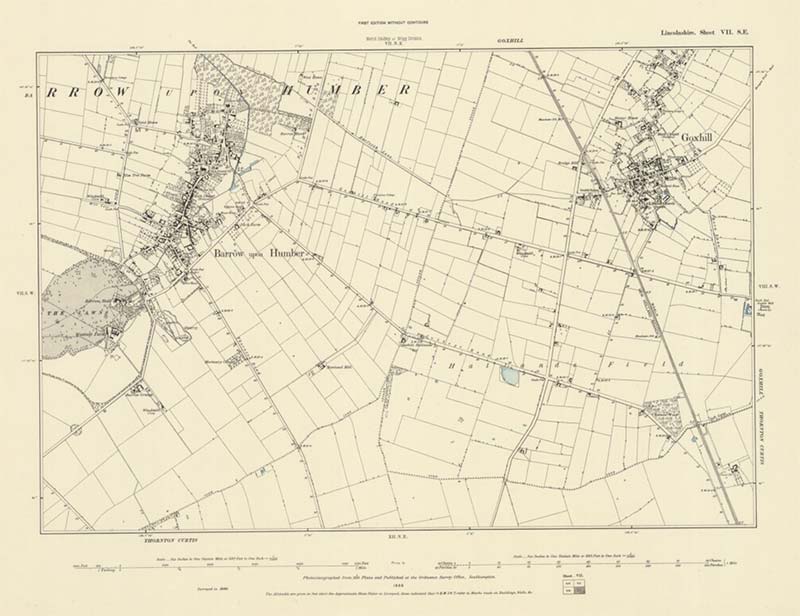
Integrate Historic Maps, Modern Aerial Imagery and Shapefiles in Arches v4 to Understand Cultural Significance
By
Dennis Wuthrich
November 21, 2016
What Does Storytelling Have to Do with a GIS Strategic Plan?
By
Dennis Wuthrich
November 16, 2016
How to Create Resources in Arches 4 Cultural Heritage Management Software
By
Dennis Wuthrich
November 9, 2016
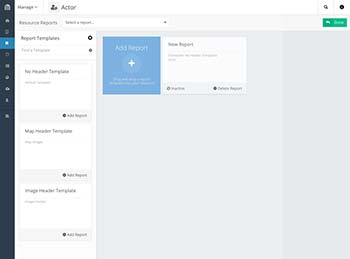
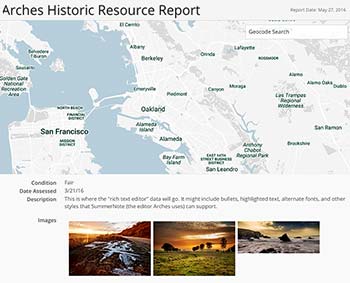
Arches 4 Lets Developers Create Custom Reports for Cultural Heritage Management
By
Dennis Wuthrich
September 21, 2016
City of Berkeley Enlists Farallon Geographics to Migrate to Esri LGIM and Leverage Off-the-Shelf Services, Applications and Workflows
Home
GIS Deployment
Solutions & Applications
Data Integration
Strategic Planning
Arches
Case Studies
Blog
Contact