Our recent agreement to implement Arches as the English City of Lincoln’s cultural heritage data management system gives us a first-hand opportunity to tune Arches for use by regional authorities across England. A prominent component of that tuning includes using historic maps to understand the significance of built heritage, from finds of prehistoric flint tools to medieval castles and Second World War pillboxes.
Historic Maps and the City of Lincoln
For example, in Lincoln, conservation officers may consult maps created in the 1700’s, 1800’s, early 1900’s, and pre- and post-WWII to help determine the setting, uses, and extent of a potentially significant building. The English Ordnance Survey (the national mapping agency for Great Britain) has an archive of many historic maps and provides them as georeferenced images. With Arches v4 we can now use these historic maps and compare them to current aerial images.
Serving Geodata from Arches v4
In Arches version 4, we’ve added a map server that allows Arches to deliver scanned maps, aerial imagery, shapefiles, and PostGIS data as slippy maps. Arches uses Mapnik to draw maps and Tilestache to manage the processing and caching of the maps. Finally, we use Mapbox GL to draw maps in your web browser.
Together, Mapnik, Tilestache, and Mapbox GL give us a great deal of control over how Arches processes GIS data and presents maps and geospatial data for use in a web browser or mobile device.
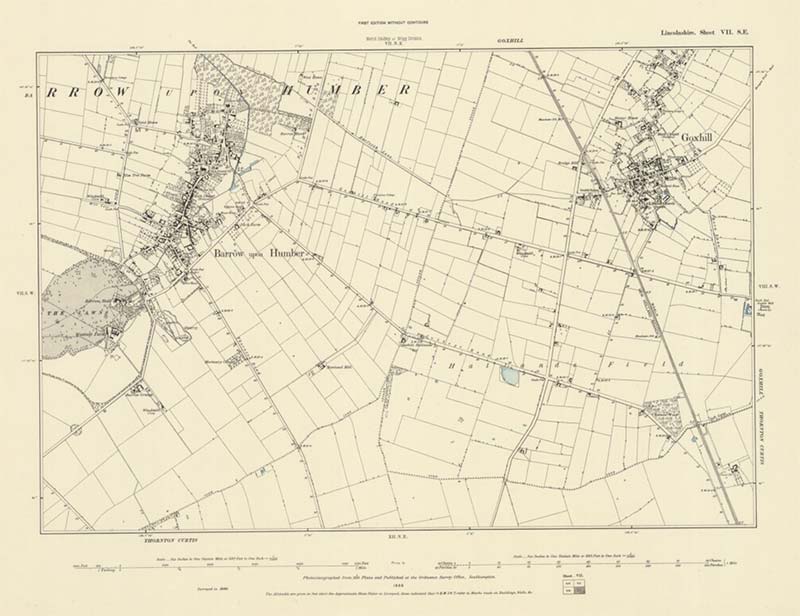
To see what’s possible in version 4, let’s take a look at how Arches can incorporate the Ordnance Survey’s 1886 maps for Lincoln.
Step 1: Understanding Ordnance Survey Map Data
The Ordnance Survey delivers historic maps as individual tiles, representing a grid cell in the National Grid. The 1886 map of the City of Lincoln is delivered as 99 individual map images, each representing a single grid cell in the British National Grid system:
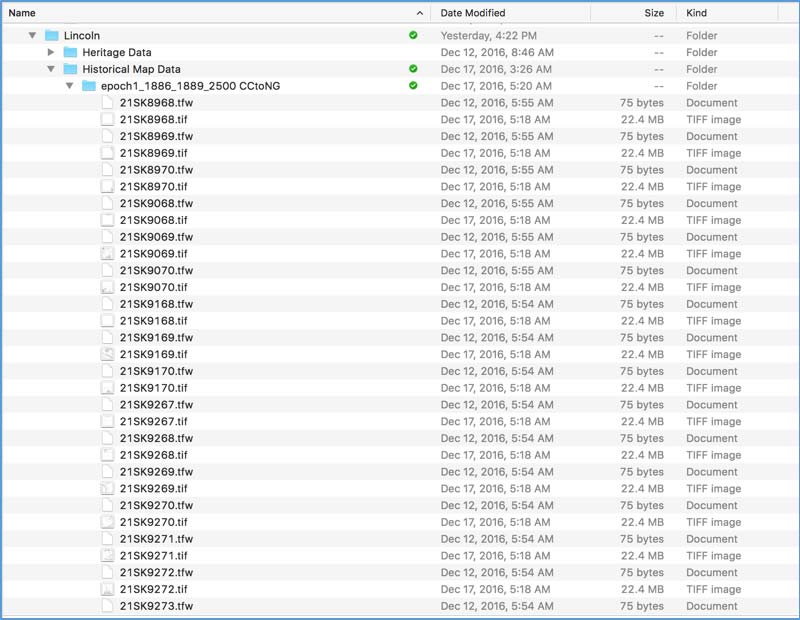
If you’re familiar with GIS data, you’ll recognize the .tif/.tfw file pairs as a way of georeferencing each image to a particular cell in the National Grid.
You can use QGIS to view the map tiles. When I opened them QGIS warned me that no coordinate reference system for the images had been set. Luckily, that’s very easy to correct.
Open QGIS and navigate to Rasters > Projections > Assign Projection…
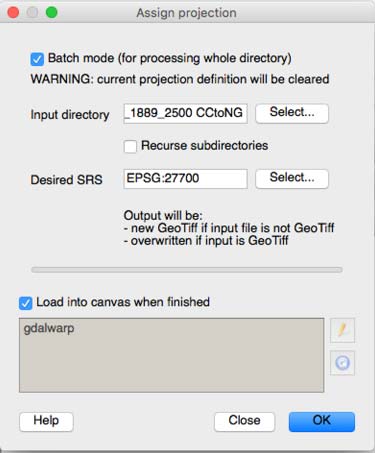
This tool lets us assign the EPSG:27700 coordinate reference system (the short-hand way of identifying the Ordnance Survey of Great Britian 1936 National Grid) to an image. Notice that you can apply this update to each file in the folder by clicking the Batch Mode option.
Step 2: Re-project the Images to Web Mercator
Arches, like Google Maps and many other mapping sites, uses the Web Mercator projection to display maps and aerial imagery. So, we’ll need to re-project our historic map images into the Web Mercator coordinate reference system. QGIS makes this task easy. navigate to Rasters > Projections > Warp (Reproject)…
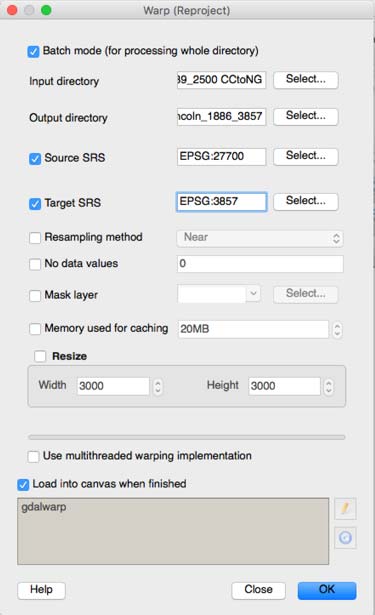
This tool creates a new folder of images with the EPSG:3857 coordinate reference system (the short-hand way of identifying the Web Mercator projection used by Google and many other web maps) to an image. Notice that you can apply this update to each file in the folder by clicking the Batch Mode option.
Step 3: Image Management
We can now use Arches to view the historic map tiles and compare them to aerial images. There’s just one small issue. Because the Ordnance Survey delivers each historic map as multiple tiled images, we’ll need to load and manage lots of individual files. In the case of the 1886-1889 map of Lincoln, that’s 99 individual files to manage.
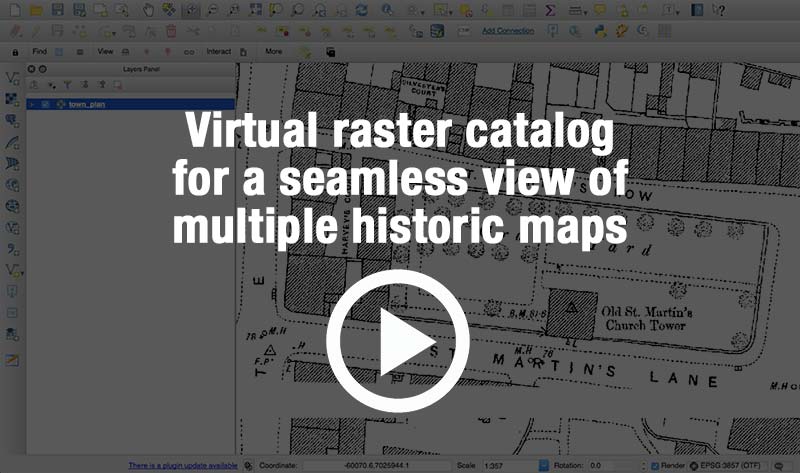
Luckily, there’s an easy way to avoid this problem. We can use QGIS to build a virtual raster catalog, giving us a simple way to define a single, seamless view of the historic map tiles. This video shows how:

Step 4: Create an Arches Map Overlay
Now that we’ve processed our historic map data, we’re ready to incorporate it into Arches’ map server. This requires defining a configuration file that tells Arches where to find our images and how to render them. We’ll use the .vrt file that we just created:
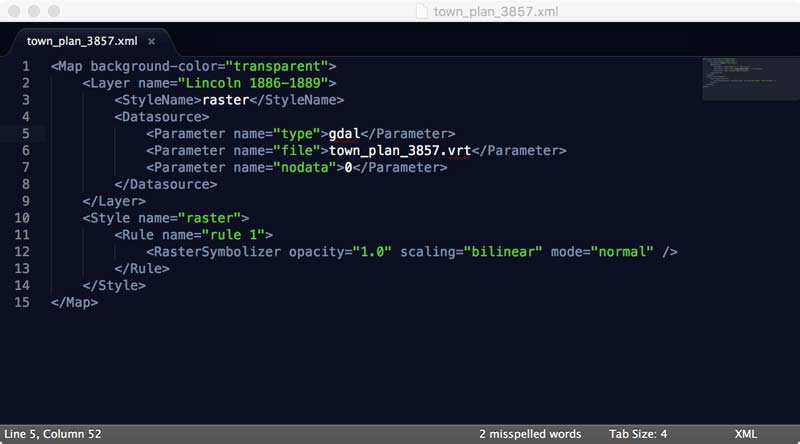
Use a virtual raster catalog to manage images and give a seamless view of the 99 historic map tiles

This tells Arches to process our historic map data (defined in the town_plan_3857.xml file) and create a map overlay (e.g.; the “add_tileserver_layer” command) and name the layer “Lincoln 1886 to 1889”.
Log on to Arches, and here’s the result:
This same basic workflow can be used to add aerial imagery or vector data (such as a shapefile or PostGIS) to Arches map overlay library.
Next Steps – Visual Map Manager
We’re working on adding a Map Manager administration page to Arches, which means that you’ll be able to create, manage, and remove basemaps and overlays without having to use the command line.
To learn more about Arches v4 or evaluate the platform for your own cultural heritage or asset management project , drop us a line or email us at info [at] fargeo.com