 One way to picture the infrastructure of almost any utility – electricity, oil, natural gas, telecommunications, etc. – is to visualize an interconnected network of different piping systems and associated components.
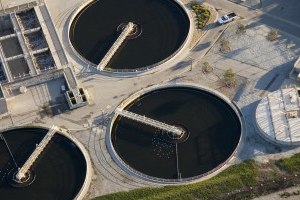
In the case of a water and sewage treatment facility, for example, there’s the Backwash In piping system that has a particular type of pipe and a particular type of valve. There’s the Raw Water In system with its own combination of pipes and values; the Return Activated Sludge system with its own pipes and valves; the Filter By-Pass system with yet another kind of pipe-valve combination. Etc. etc.
A small to mid-scale treatment facility can easily have 30 or more different piping systems, and over 200 layers of associated system components.
Visualizing Complex Infrastructure Assets & Processes
Tracking, visualizing, managing and communicating all of these different layers of piping, associated infrastructure assets (valves, filters, fittings, communication fiber, etc.), as well as maintenance workflows, is an essential requirement for any treatment facility. However, typically these components are accessed and managed by different departments across the organization.
For example, treatment plant infrastructure information will be catalogued in CAD software, accessible to the plant CAD engineers. For the plant supervisor who is not an AutoCAD aficionado, if they have a project to add in a new fiber communications system and want to avoid digging into an existing wastewater overflow piping system circa 2007, they would need to visit the engineering department to access the data in AutoCAD and print out the layer identifying some code for wastewater overflow piping like “SC_47W”. If the supervisor wants to annotate and share this information as part of a work order, they do it on the paper printout and distribute hardcopies.
Accessible, Interactive GIS/CAD Layers
But a centralized, GIS-based solution can make this more accessible and interactive using a web based Google-map like visual interface. Any authorized user can easily view and overlay any GIS/CAD layers and associated assets. Click on a layer or feature to change labels (e.g. SC_47W becomes wastewater overflow piping) or get more detailed information about that item (e.g. built in 2007, dependent on backwash out system, etc.). Annotate, redline or draw directly on a new map layer and share this with colleagues. No CAD or GIS experience required!
Mapping as a Workflow Management Solution
From a workflow perspective, layers no matter how well labeled are not enough. Ideally when doing a project you want some way to group and categorize layers and assets related to a project. In a GIS/Mapping solution this is nothing more complicated then defining a project or category and adding in layers with associated information. Underneath every category a user can then see the layers, a description of the layer, the last time it was updated, any markup (timelines, caveats or redlines) and just about anything else you want to include. You could even save these categories and share them with colleagues.
Finally since this is all part of geo-aware database, a GIS solution enables you to run simple or advanced search queries to find specific components or higher level Meta data. You can then share the resulting search data and visual map with others.
A focus on projects and workflow is one of the most compelling features of a GIS solution for treatment facilities. By enabling custom groupings, engineers, technicians and supervisors can easily collaborate on projects and all share relevant information both visually and tabulated. For common workflow tasks such as checking to see if a dig would impact any existing systems, a GIS solution can group together and visually display all underground lines and assets in a given area that could be affected by the planned dig. Other frequent workflow tasks could similarly be defined and saved.
User interface moves GIS beyond the realm of technicians-only
Most people don’t immediately think of GIS as a workflow management tool usable by non-technicians. But at Farallon, our recent work focuses on designing GIS-based solutions with accessible, user-validated UI can be used to facilitate project management and common workflows.